Out With The New, In With The Old

Hi All,

2026 is upon us, and while January felt like it lasted forever, February is starting to fly by.  In our last post, we wrote,  “Given oil is trading near 5-year lows and equity market valuations are in top 10% of historical ranges, we feel energy, in particular, offers a compelling investment case and we will begin to build this into client portfolios early in 2026.”  So far in 2026, the OIH (Oil Services ETF) is up 34%.  Did I mention that it’s still February?

Coupled with the resurgence of unloved (and traditionally defensive) sectors, we’ve seen a Rorschach test of economic data points.  Challenger recently released that announced job cuts in January was the worst January since 2009.  The stock market bulls shout, “AI is making companies more productive, so profit margins are going to the moon!”  Stock market bears retort, “Less people with jobs is bad for the economy!”  This constant push and pull of an ever-morphing economic environment has started to bleed into the stock market as well.

The year-to-date underperformance of US equities relative to the rest of the world is the worst since at least 1995.  Bears confidently claim the “Sell America” trade is alive and well.  Bulls note that a broadening of the rally outside of the Magnificent Seven tech stocks (which have gone nowhere since last summer) is extremely healthy.

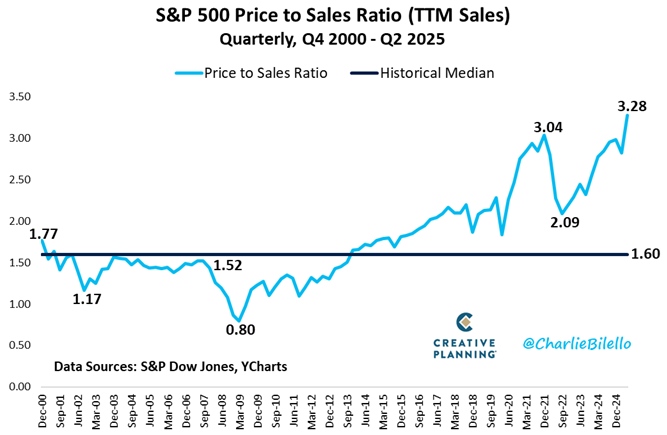
The sector leaders in the early part of 2026 are clear: Consumer Staples, Utilities, Energy, and Real Estate.  Traditionally, these sectors are not indicative of a booming economy (banks and semiconductors usually take the lead on the way up).  Investors falling all over themselves to buy Walmart and Costco at 50x earnings doesn’t quite give me the warm and fuzzies.  Couple that with the spike in the price of precious metals (silver was up 144% last year), the stunning decline in the software sector (entire group is down 22% YTD), ever-present geopolitical tensions, and mortgage rates remaining stubbornly high, this market has the look and feel of something that needs a breather.

We’re still expecting a modest broader decline in the first half of 2026, and we’ve built portfolios to not only withstand this decline, but to take advantage of the opportunities that it will present.  Watching the market on a day-to-day basis has been filled with massive amounts of noise, but I just want you to know that we’re prepared for whatever may happen.

“It ain’t what you don’t know that gets you into trouble. It’s what you know for sure that just ain’t so.” – Mark Twain

– Adam

The Year in Review and A Look Ahead

Hi all,

It’s been a few months since my last post, but the honest truth is there hasn’t been much to say.  Since October 1st, the S&P 500 and the Nasdaq 100 are both up about 1%.

We expected a 5-10% pullback in equity markets that would offer an opportunity into the end of the year, and that’s exactly what happened.  The S&P and Nasdaq made new all-time highs on October 29th and then proceeded to fall 5.7% and 8.8% respectively.  We put a little more cash to work for those clients making periodic contributions and the market has been hyper-focused on interest rates and AI-related stories while the overall indexes have pretty much gone sideways for two and a half months.

2025 may be remembered as the year where almost everything worked.  The S&P 500 is up more than 15%.  European stocks are up 30%.  Our preferred emerging markets ETF (FRDM) is up 49% this year.  Gold is up 65% and silver is up 125%.

In our opinion, this is reflexive front running of the current administration’s “run it hot” economic strategy.  The contention is our only way out of future debt and economic issues is to “grow our way out of the problem”.  While that may or may not end up occurring, what we do know is that it rarely happens in a straight line.  Next year is a mid-term election year, and the last two mid-term election years (2018 and 2022) were extremely unkind to stock market investors.  So can we expect the same for 2026?  Let’s dig in…

  1. Investors Remain Extremely Bullish
Image
Past Performance Is Not Indicative of Future Results

According to the AAII (American Association of Individual Investors), total stock allocations, as a percentage of their overall portfolios, is about the same level as 2018 and 2022 (those years keep popping up in my research).  Generally when stock allocations are high, there are less and less incremental buyers and typically a shakeout is needed to sow the seeds for the next advance.  Risk/Reward is generally poorest when investors are “all-in”.

2. Artificial Intelligence Is Coming

Image
Source: Open AI Past Performance Is Not Indicative of Future Results

We believe this is a secular (long-term) trend, that in the short-term will immensely improve the overall productivity of the economy as well as the profit margins of the largest adopters of AI (think Mag 7 companies).  As the labor market continues to soften, the Federal Reserve has remained resolute in lowering interest rates to combat this trend and bolster employment.  While it’s possible this is more of a story for 2027, we feel a tipping point is nearing where less and less human capital is needed for our everyday lives.  While we don’t think that everyone will be displaced immediately, we do think a transition period where traditional labor is redirected into other sectors may be bumpier than most are considering.

3. “Run it Hot”

Image
Past Performance Is Not Indicative of Future Results

Similar to the decoupling of gold to the rest of the commodity complex in 2020, we believe that traditional commodities (oil, corn, sugar, soybeans) will provide nice diversification in 2026.  As the Federal Reserve pushes on a string (rate cuts don’t provide as much help to the jobs market as people think), we believe the market quickly turns from economic concerns to an “overheating” of economic conditions.  Given oil is trading near 5-year lows and equity market valuations are in top 10% of historical ranges, we feel energy, in particular, offers a compelling investment case and we will begin to build this into client portfolios early in 2026.

These are just a few of the potential pitfalls of 2026, but the reality is that things are actually pretty good right now.  The economy is growing around 3.5% per year and inflation is around 2.5%, which means that the “real” growth rate is approximately 1%.  As mentioned before, the administration will do everything they can to get GDP as high as possible before the midterm elections.  Being too negative in front of a government running multi-trillion dollar deficits, interest rates that are heading lower, and the prospect of AI creating another productivity boom akin to the infancy of the internet, feels like a fool’s errand.  Short-term concern, mixed with long-term optimism is the right mix for continuing the long-term compounding performance we’ve achieved.

“No pessimist ever discovered the secrets of the stars, or sailed to uncharted land, or opened a new doorway for the human spirit.” – Helen Keller

Happy Holidays Everyone!

– Adam


Complacency

“We have nothing to fear but the lack of fear itself.” – Walter Deemer

Hi everyone,

Earlier this month, the Nasdaq 100 had been higher for nine straight days, tied for the longest streak in the last four years.  The semiconductor index had been up eight straight days, tied for the longest winning streak in nearly eight years.  The largest “dip” in the S&P 500 since April has been a paltry 3.3%.  The economy has held up better than most have expected in the face of tariffs, declining job growth, and inflation which has remained stubbornly sticky above the Federal Reserve’s 2% target.

Most client accounts are up low-to-mid double digits in percentage terms for the year, which is always nice, but I feel complacency starting to creep in.  It’s tough to diagnose, but the assumption things are going just fine and look as though they will remain positive for the foreseeable future is dangerous.  I like to say that it’s always the car you don’t see that crashes into you.  In that same vein, I’d like to take the opportunity to focus on a few vehicles that might be hiding in our blind spot.

  1. Things are good, but to us, that means they can’t get much better.  Currently 65% of NYSE stocks are above their 200-day moving averages.  It’s a great time to be fully invested, but over the last 5 years, that number tops out around 70% before things change. (tip of the cap to Kevin Gordon, Schwab Senior Investment Strategist)
Image
Disclaimer: Past performance may not indicate future results

2. Serious credit card delinquencies (unpaid balances for at least 90 days) are at their highest levels in 14 years.

Image
Disclaimer: Past performance may not indicate future results

3. The S&P 500 is now trading at 3.3x revenues, its highest valuation in history.  This is just one metric to show valuation, but even if we look at Price to Earnings (P/E ratio), we’re currently at 23 times earnings.  In every single case in stock market history, the 10-year annualized return over the next 10 years has been between +2% and -2% per year.

Image
Disclaimer: Past performance may not indicate future results

4.  The S&P 500 has traded more than two standard deviations above its 50-day moving average for the first time since December.  As you can see from the chart below, ideally you would be to be lightening up in the red areas and adding to market exposure in the green areas.

Image
Source: Bespoke Research Disclaimer: Past performance may not indicate future results

As you know, our company line over the past 7-8 years has mostly been the traditional stuff you will hear from any financial advisor.  Stay the course. Stay fully invested. Time in the market always beats timing the market.

While all of this is true, and none of the information above is a crystal ball about WHEN the market will start caring about the weakening economic picture, history does tell us we should be preparing more for a decline than a melt-up.

If you’re someone who is close to retirement, someone who would like to lighten up and get a little more defensive, or just someone who is willing to forgo some upside after a great 8.5 months with the chances of having a little more cash to deploy if/when things start to go sideways, now is the time.

We will be reaching out to everyone individually, but feel free to reach out to us as well.  We believe the risk/reward of investing at these levels is a coin-flip, at best, and caution remains warranted.

I’ll leave with a quote from the movie Spy Game.  It’s a 2001 movie starring Brad Pitt and Robert Redford (RIP).  They are both CIA operatives, and at one point in the movie, Redford turns to his assistant and asks, “When did Noah build the Ark?”.  She shrugs, as he says, “Before the rain”.

– Adam


The Trend is Your Friend, Until the Bend at the End

“There are two ways to use money. One is as a tool to live a better life. The other is as a yardstick of status to measure yourself against others.” – Morgan Housel

Hi all,

It’s been a little bit since my last update, and the valuation of the S&P 500 remains stretched.  It is currently in the 93rd percentile of valuation in history, which is only to say there is a lot of optimism built into the market.

In the last quarter, something amazing occurred.  Per the chart below, the amount of AI-related spending as a percentage of the overall economy became larger than all the other consumer spending in the economy.  You’ve heard me say it many times to never bet against the American consumer.  But in this case, everyone’s betting on artificial intelligence making companies more productive.

Image
Disclaimer: Past Performance is not indicative of future results

At some point valuation matters, and if you’re looking at the numbers in a vacuum, we’re very close to the same valuation metrics we last saw at the height of the tech bubble in 2000.

Image
Disclaimer: Past Performance is not indicative of future results

We continue to believe that the market needs a decent pullback (3-10%) to reset some valuations, and we believe that pullback will occur in the next 60 days.  Historical data shows that when the S&P is positive for May, June, and July, the period between August and mid-October is bumpy (to use a nice term).  The good news is that the period post-October through mid-January is positive 17 out of 17 times, for an average gain of 7%.

Image
Disclaimer: Past Performance is not indicative of future results

The S&P 500 is up 30% over the last 16 weeks (almost 2% per week).  The only thing we know for sure is that it’s not sustainable.  We’re still looking for that pullback to put additional money to work and we will stay patient to try and not chase this market where seemingly everything is working.

– Adam

If It Ain’t Broke…

“A bull market is a bull.  It constantly tries to throw off its riders.” – Richard Russell

Hi all,

As the S&P and Nasdaq make all-time highs it’s important to look back at where we’ve been, why we continue to stress the boring (low-cost ETFs, diversification, etc.) and while those dynamics are not the holy grail of investing, we don’t see a need to change our tune until the market changes first.

I will be the first one to tell you.  I didn’t think we’d be here.  If someone had told me there would be higher corporate taxes (tariffs), massive uncertainty in the domestic and international political scenes, and literal acts of war, I would have said we’d be 20% lower, until those things get sorted out.  And it’s the speed of the sorting that’s been the real surprise.  Tariffs have been a boon to the coffers of the United States without raising prices for most consumers, a deficit-expanding, tax-cutting bill is currently making its way through Congress, and inflationary pressures continue to subside just as the labor market starts to soften a bit, leaving the door open for rate cuts in the second half of 2025 and first half of 2026.  Warren Buffett said it best, “If you mix politics with your investment decisions, you’re making a big mistake.”  Here’s a reminder why.

Image

Bear markets and large draw downs are part of the deal.  The longer you’re in the market, the higher the likelihood you’ll experience some tough times, but it’s how we handle these tough times that makes all the difference.

Image

Another reason why we’ve been preaching “stay the course” and “rebalance” isn’t because we read it in a book somewhere and don’t have an opinion of our own, it’s because it’s worked.  In fact, it’s worked better over the last 15 years than any other rolling 15-year period since 1970.  There’s a little bit of cherry picking the data as 2010 followed one of the worst bear markets in history, but the optimal strategy here was to be long stocks through thick and thin.  Those of you who lived through 1974-1982, and even 1998-2009, know that longer periods of stocks moving sideways is absolutely possible.  Coupled with the complacency in today’s marketplace with rallying cries like “buy the dip” and “stocks always go up” it all just feels a bit misguided.  But just as we should be diligent about the rug being pulled out from under our feet, we should give the same credence to the possibility of a bull market run lasting longer than we think.

Image

Given the stock market’s proclivity for looking past short-term uncertainty because future help is on the way (rate cuts, tax cuts, trade deals, etc.) we continue to believe that any pullback in the market should be an opportunity to put more cash to work.  That being said, we’ve been waiting for several weeks for one of these dips to materialize, but have yet to see anything that offers even the smallest amount of value.  We remain patient to get clients up to optimal stock allocations and are steadfast in waiting for the right opportunity to jump in for those of you making periodic contributions, rollovers, etc.

“Optimism sounds like a sales pitch.  Pessimism sounds like someone trying to help you.” – Morgan Housel

Happy 249th Birthday America!

– Adam


Now What?

Everybody in the world is a long-term investor until the market goes down.” – Peter Lynch

Hi all,

As you may know, we were looking for a “snapback” rally after the S&P 500 had dropped over 21% from its all-time high on February 19th until April 7th.  Since then, we’ve seen a 23% rally off those low prices, and we now sit about 3% of the way from all-time highs on the S&P 500, and most portfolios are now slightly positive on the year.

Sitting through the decline, even with the knowledge that a bounce was inevitable, is never easy.  But these are the times when having a professional manage your money and your emotions is invaluable.  I’d like to think that we’re going to side-step a recession in the coming months and finish the year markedly higher than we are right now, but we’re not quite ready to make that call just yet.

Let’s take a look at some of the bigger headlines, and how we see the next few months playing out.

  • Moody’s Credit Downgrade
Image
Past Performance is not indicative of future results

Moody’s downgraded the U.S. government’s credit rating for the first time since 1917.  While this may evoke some memories of when S&P Global did the same thing in 2011 (the S&P 500 was down 6% the next day), the move itself is much more symbolic than earth shattering.  At the time, in 2011, the possibility of a credit downgrade was unthinkable, but mostly disturbed pensions, endowments, and large institutions that were forced to only purchase AAA rated securities by their investment policy statements.  This led to major short-term volatility, but since those problems were addressed over a decade ago, we don’t see the same thing happening again.  The future concerns over stable or rising interest rates in the face of a deteriorating housing industry and a ballooning (and going higher) national debt are the larger issues to keep in mind.

  • Tariffs and Geopolitics
Image
Past Performance is not indicative of future results

I know I’ve told most of you this but the Trump 1.0 playbook for negotiations was relatively simple.  Create Crisis –> Expand Crisis –> Remove Crisis –> Declare Victory.

As you can see from the chart above, this time was no different.  The market’s response (and it was a logical one) was that 50%-150% tariffs on Chinese imports was effectively an embargo on all Chinese goods.  The potential seizure of global trade markets sent both sides into a tailspin and investor’s expectations and imaginations went along for the ride.  Now that cooler heads have prevailed (most notably Treasury Secretary, Scott Bessent), the reality of the situation is that 30% tariffs are better than 145%, but worse than initial levels of 2025.  This has all been a net negative, but it will be far less net negative than it could have been.  The million dollar question remains whether the consumer can stay resilient enough to weather the storm, and how much of the added corporate tax (that’s what tariffs are) gets passed along to consumers.

  • Stock Market Internal Strength
Image
Past Performance is not indicative of future results

It’s very true that the largest percentage moves in the stock market come in bear markets.  The question here is now whether the rally we’ve seen is a “bear market rally” and stocks are destined to revisit their April low prices, or have we started a new uptrend?  The chart above says, all-time highs are highly likely over the next 12 months, as the market triggered one of my two favorite market signals in late April, the Zweig Breadth Thrust.  Essentially, this occurs when the market moves from a deeply oversold condition, into a strongly overbought one, in a short period of time.  Since WWII, this signal has triggered 20 times, including this one.  The S&P 500 was higher a year later 19 out of 19 times, with an average one-year gain of 23.4%.  If you want to ignore history, or what’s actually happening in the stock market, that’s up to you.  There are no holy grails in investing, but this one is as close as it comes.

The major takeaway should not be that stocks will immediately move to all-time highs, but with the added confidence and likelihood of higher prices over the next 12 months, we are looking to put extra cash to work on any significant dips (monthly contributions, rollovers, excess dividends).

– Adam

The Second Level Playbook

Hi everyone,

I’ve spoken to a lot of you individually already, but it’s definitely time to increase the pace of communication, so we’ve decided to do an intra-month blog post.

This past week was just the fourth time since 1952 (when five-day trading began) that we had a 10%+ two-day drop for the S&P 500.  The other times?  October 1987, November 2008, and March 2020.  In terms of actual dollar value of the companies, it was, by far, the largest decline in the history of the stock market, surpassing 6.6 trillion dollars lost on Thursday and Friday.

This market is going to scare a lot of people. But remember that volatility and uncertainty is the price of admission to the stock market. Without short term pain there cannot be long term gains.  

Try to avoid overreacting. Some will be tempted to move all to cash or make extreme moves. You’re not playing poker. You’re allocating your savings. If your portfolio feels like a casino you’re doing this all wrong. 

So, what are specific things you should do in environments like this?

  • Revisit your financial plan. If you absolutely must raise cash then do it, but not 100%. The average duration from a bear market bottom to new all-time highs is roughly two years.  Move enough to weather an economic hurricane, but none more.
  • Tax loss harvest. Consider swapping highly concentrated positions into similar, but more diversified allocations, or even the possibility of ROTH conversions to pay taxes up front on a lower amount and letting those gains grow tax-free vs. tax-deferred.  
  • If you are lucky to have excess cash, consider dollar cost averaging into the market. 
  • Stay the course, if you can. If you have a good plan in place, times like these should be almost irrelevant. If you feel tempted to make big shifts it probably means your risk profile is off. 
  • And the biggest one. TALK ABOUT IT. If you’re sitting on stressful losses or volatile positions, talk about it. Get advice and opinions. Don’t bottle it up and let it eat you. 

The time to make money 2 to 5 years from now is today.

We are here to answer any questions, offer any advice, and even serve as a punching bag or a place to vent about the current state of the world. It helps. Trust me.

Talk soon,

Adam

March to the Beat of Your Own Drum

Hi all,

The word of the month on Wall Street has been “Uncertainty”.  Uncertainty surrounding fiscal policy (government spending/cutting).  Uncertainty surrounding monetary policy (will the FED cut rates this year, and if so, how many times?).  Uncertainty surrounding geopolitics.

We believe the reason so many investors have been caught off guard to start 2025 was because they believed uncertainty was low.  But like gravity, uncertainty exists everywhere and always, whether you believe in it or not.

We’ve seen a clear move out of the darlings of 2023 and 2024 into more defensive sectors, as well as into unloved and cheaper parts of the markets like international stocks and energy names.  Those of you who have been cursing us under your breath for our steadfastness with regards to international exposure (rightfully so), are now seeing the benefits of diversification and enjoying a smoother ride than the flavor of the month club.

This year’s price action in the wake of a first year of a presidential term, and a year following back to back 20%+ returns on the S&P 500, has been pretty typical.  Bumpy, sideways action, followed by sharp snap backs, as the market decides where it wants to focus.  The only thing that’s really stood out to us has been how bearish the market sentiment has become, without price being the primary driver (it’s been dysfunction of government this time).

Let’s look at a few of the psychological metrics we follow.

Our first chart comes from Jay Kaeppel, Senior Market Analyst at SentimenTrader.  His own proprietary Panic/Euphoria model has gotten to a level seen 7 times in the last 25 years.  Each time over the next month or so, the road continues to be bumpy, but looking out 12 months, average returns are in the 30% range (not a prediction, but it’s an outcome that very few are giving appropriate consideration).

Image
Disclaimer: Past Performance is not indicative of future results

Next, we have some data from Ryan Detrick at Carson Investment Research.  This chart shows the number of times we saw the persistent and broad type of buying we saw last week.  In the last 40 years, it’s only happened 11 times where we saw 90% of all stocks in the S&P 500 going higher two days in a row.  Again, the bias here shows that the next 1-3 months remain sideways to positive, but 12 months out, positive 100% of the time.

Image

Disclaimer: Past performance is not indicative of future resultsBut, it’s never easy.  Using a volume-based metric, the last six times we’ve gotten these back-to-back “thrust” days, we’ve seen a short-term “retest” of these lows to confirm that the buying pressure in the market is real.

Image
Source: Tradingview Disclaimer: Past Performance is not indicative of future results

So what does it all mean?  It means 12 months out from these signals, we are very bullish, but in the short-term expect some more pain and the market heading back toward lows as things start to look dicey again.  As the great Walter Deemer would say, “Most climactic lows are usually tested at some point, but not all tests are successful.”  At the moment, we believe the retest will hold these current lows, and most likely the market’s next bounce will be the best buying opportunity for 2025.  We also still believe that new all-time highs are very possible for later this year.

– Adam


Opportunity Knocks?

“There are far better things ahead than any we leave behind.” – C.S. Lewis”

Hi all,

As I write this post, the Nasdaq is down about 5% for the year, the Russell 2000 (small businesses) is down about 7% for the year, and the S&P 500 is down 2%.  Traditionally, after a 20%+ year for the S&P 500, weakness in the first few months is to be expected.  Also, post-election years tend to be weak at the beginning as well.

Image
Past Performance is not indicative of future results
Image
Past Performance is not indicative of future results

As was the case in 2024, we saw an 8% decline from all-time highs in mid-March 2024 until late April of that year.  For the moment, we view the current state of affairs in much the same way.

But Adam, haven’t you seen the tariffs, and the unprecedented political unrest!

Of course, I have.  There’s always a new REASON why the outlook starts to sour, and some of these shakeouts turn into larger problems, but trying to predict or front-run the specific falling of dominoes among countless variables just doesn’t feel possible (or smart, for that matter).

I’d rather just wait on the sidelines until all this gets figured out.

I know.  You and everyone else.  In the latest survey of the American Association of Individual Investors (AAII), we saw the fourth most bearish reading in the last 30+ years.  The other three readings?  October 2008, March 2009, and September 2022.  In the general vicinity of major market low points (best times to buy).

Image
Past Performance is not indicative of future results

But in today’s case, we’re only a couple percentage points off all-time highs.  The S&P 500 made a new all-time high 13 days ago.  How did we get from all-time highs to bear market bottom sentiment?  Some people point to the fact that the survey is outdated, no longer representative of stock market positioning, etc.  They may be correct, but my research includes many different data points, and this has always just been one piece of the puzzle.  The other pieces are not flashing anywhere near the bearishness we see from the AAII survey, but that’s also changing as the market continues to struggle.

Something more interesting is that last week when the S&P 500 was only 2% off it’s all-time high, 60% of the stocks in the index were down 10% or more from their respective 52-week highs, and 33% of them were down 20% or more.  As the kids would say, “Index investing, for the win.”

We never know where the money will rotate, but we do know that people will look elsewhere when growth stock momentum starts to weaken.  Who would have thought that European stocks would be up almost 9% while the S&P struggles to tread water?  No one.  That’s why we’ve stuck with geographic diversification.

“And why is investing in stocks a good way to do this? Well, because every day, hundreds of millions of people wake up, go to work, and produce goods and services at companies.  Ultimately, by being an owner in those companies, you’ll get paid for their efforts via dividends and earnings growth.  It’s like riding capitalism’s coattails.” That’s from Eric Balchunas, author of The Bogle Effect.

Don’t get short-sighted on the opportunity the market is giving us, and learn to embrace the short-term uncertainty.   We think we’ve got more downside to go, but perhaps not too much more.  We will be prepared when it’s time to capitalize again (just as we did in late 2022, March 2020 and December of 2018).

Turn off the TV.  Go to a restaurant on a Saturday night, or talk to a small business owner.  Use more of your eyes than your ears in times like these.

Talk soon,

Adam


The More Things Change…

Hi all,

As you know, we’ve been cautious the last several months (especially on large cap companies) as the equity market valuations have kept us from committing some capital with relative confidence.  Hearkening back to November’s post, we wrote:

“This is not to say that the economy or the stock market is going to crash, but trees don’t grow to the sky.  It’s often the car you don’t see that causes the accident, and we continue to believe that caution in adding additional capital to equities (large cap equities specifically) at nosebleed valuations is warranted.”

We now know the “cars”:  Last week it was Deepseek, this week it’s tariffs.

One unsubstantiated media report led to the largest one day decline in terms of market cap ever in US history (Nvidia lost roughly $600B on Monday).  I am not an artificial intelligence expert, nor do I play one on TV, but the short story is that an AI firm out of China has claimed to duplicate the computational prowess of some of the fastest growing and largest US technology firms for a tiny fraction of the cost.

I have no idea if this is true.  You have no idea if this is true.  But the takeaway from this week’s decline in the stock market SHOULD be that when you build in positive assumption on top of positive assumption, you leave yourself open to a small negative possibility causing an out sized amount of pain to your portfolio.  It’s just a poor risk/reward trade.

If you are someone who wants to parse through how this potential cost-cutting technology could be revolutionary for how much spending the large technology firms won’t have to make in the future, or who the winners and losers could be in a global trade war, go ahead.  It’s a fool’s errand.  Think more about what this DOESN’T change.  The future needs for cybersecurity.  The potential applications for the future of individualized healthcare.  The ability for firms who couldn’t commit the amount of money needed to play in cutting edge technologies, now being able to implement cost savings measures in their own businesses.

Now let’s look at a few charts (my favorite) to see where we are to start 2025.

  1. The NYSE Advance-Decline Line Divergence

Image

The S&P 500 made a new all-time high in price on January 22nd, but the numbers of stocks inside the S&P 500 has not confirmed that high in price.  We had a similar divergence in November of last year that rectified itself by the advance-decline line making a new high late in the month, so that’s not to say that all divergences lead to declines, but most declines start with these types of divergences.  Something to keep a very close eye on.

2. Some rationality in valuation is a positive for this market.

Image

Last year’s winners have started 2025 by coming back to the pack a bit.  The only sector down this year (I know it’s early) is technology.  This broadening out of the stock market is generally a net positive (unless you’re overextended in technology and semiconductors).  We see this broadening as an opportunity to continue to build positions in client portfolios in the unloved sectors from the last several years (healthcare, real estate, energy), and we will likely overweight small or mid-caps over large and value over growth.

3. Post-Election Years

Image

While pre-election years have been the best performers over the past 75 years, a new trend has emerged in the last 40 years, with post-election years being the largest gainers.  Over the past 10 cycles, 9 out of 10 have been higher, with an average gain of 18.1% per year.  Since the market has a bullish bias anyway (stocks DO go up over time), you can always torture the data into saying what you want, but it’s certainly on the positive side of the ledger for 2025.

The net effect of all of this is that fear and uncertainty have entered the stock market in a big way to start 2025.  Most see this as a negative, but a broadening out of the bull market should simply be seen as new leaders taking the baton.  Don’t make the mistake of thinking yesterday’s winners will be tomorrow’s darlings, too.

– Adam