
Hi All,
After our last post on May 26th, the markets finished their best week of the year with the S&P 500 and Russell 2000 rising 6.5% and the Nasdaq 100 up a little over 7%.
But since then, the S&P 500 has fallen into an “official” bear market. Per Jason Goepfort of Bespoke Investment Group, it proved to be the first time the S&P ever failed so quickly after a 7% relief rally. To be honest, regardless of whether or not the S&P 500 went down 19.8% or 20.1% means little difference to professional market watchers. We ARE in a bear market, and in our view, it’s been a bear market for a little over a year (regardless of the major indexes holding up through most of 2021). According to Bank of America, over the past 140 years, there have been 19 bear markets with average price declines of -37%, but more importantly the average duration of these bear markets (through the accepted definition) has been 289 days. As far as seasonal trends are concerned, per the Stock Trader’s Almanac, Q2 and Q3 in midterm election years have been historically weak (although not as much in the last 10 years or so).
What does it all mean? Should we expect a bounce, and use that as an opportunity to lighten up on stocks before they head back down again? Will we see “traditional” capitulation?
The great financial writer for the WSJ, Jason Zweig, tells us that there are three ways to get paid to write:
-
- Lie to people who want to be lied to, and you’ll get rich.
- Tell the truth to those who want the truth, and you’ll make a living.
- Tell the truth to those who want to be lied to, and you’ll go broke.
The truth here is that we don’t know. Our best guess at the moment is that we are in for another substantial decline later in the year (a retest of the recent lows) to coincide with the seasonal trends, probably around 3400-3500 on the S&P 500 (essentially back to Feb 2020 levels). I would peg my conviction of this view as 70% retest and 30% we start to base around these levels and make our way back toward all-time highs (I know, I know, blasphemy).
The case being made for us moving higher from here, but not going back down is gaining traction, but there are a couple main pieces to the argument:
-
- Sentiment is still at historic lows. But as of right now, sentiment has been as historically low levels for months, with very little movement back to the upside (and very little to be optimistic about).
- According to the Bank of America Global Fund Manager Survey, the cash balances in customer accounts have risen to a level greater than April of 2020, the highest figure in the last 20 years. This is potential fuel for the next advance as naysayers become believers when prices go higher, which is the exact opposite of how you should view investing. The stock market is the only place I can think of where people get scared when stocks go on sale.
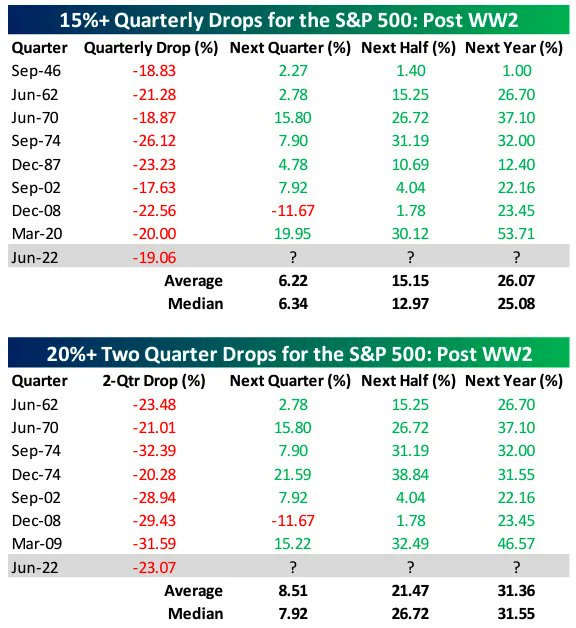
- Most importantly are the historical comparables to what happens when the S&P 500 drops 15% or more in a quarter (this would only be the 9th time in history). As you can see from the chart below. The next quarter is up 6% on average, and is 15% higher on average over the remaining half of the year.
I think we tend to move a little higher from here and then we see how the market reacts. While past performance is not indicative of future performance, past behavior is. This is why during every cycle, the names and fears change, but humans don’t. Buying into fear and selling into greed will stand the test of time. The hard part is figuring out when the market is fearful enough and when it turns back to greed.
– Adam