
Hi all,
In our late June post, entitled Bear Market Rally or Something More?, we stated, “I think we tend to move a little higher from here and then we see how the market reacts.” Since that time, we have rallied more than 500 S&P points (13%), before giving up about 7% over the last week or so. So for our purposes, the “fear fever” has broken and investors are starting to breathe a small sigh of relief.
In both 2001 and 2008 (the major bear markets of recent memory), the stock market never rallied more than 50% of the decline once “the bottom was in”. That level was 4231 on the S&P 500. On a weekly closing basis, we closed at 4280 on August 12th (a feather in the cap of the bulls). The problem here is that even IF the “bottom is in”, the short-term average and median gains over the next 20 days were -2.71% and -4.88% respectively.
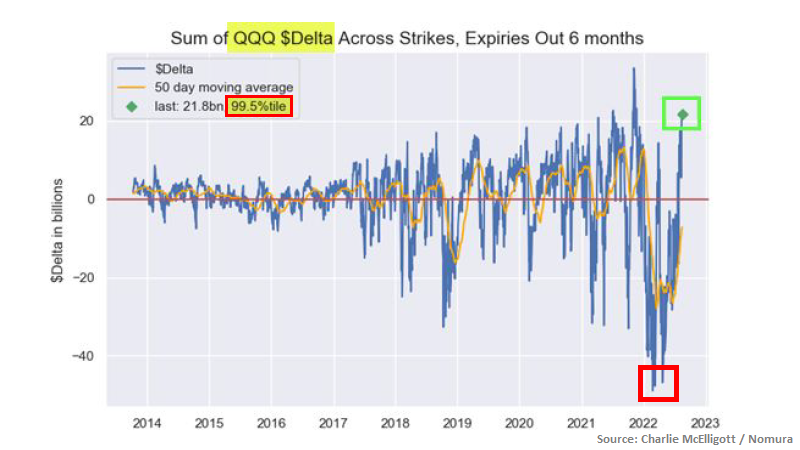
What does this mean for you? Our perspective at the moment is that the market has removed most of the negative excesses. Price has actually risen so quickly, that almost all sectors are now in an “overbought” condition and in our opinion the market needs a bit of rest (which we’ve seen). Per Charlie McElligott from Nomura, see the chart below. Essentially we’ve gone from peak “fear” to peak “fear of missing out”.
But as of this writing, we’re still sitting right in the middle of the massive range from the beginning of the year and there’s no discernible edge from a technical or fundamental standpoint until we get new information (inflation data, jobs reports, etc.). It is entirely possible we move sideways until the midterm elections.
At this point, the sector most attractive to us from a supply/demand imbalance as well as a current yield perspective remains energy. Energy firms have been decimated over the past several years and those that weathered the storm are built for survival at $40/bbl oil. Even as crude oil has come down substantially from mid-June, we are still hovering near $90/oil. It is likely the free cash flow yield (dividends + share buybacks) of energy companies in 2022 will be greater than it has been at any time over the past 30 years, while at the same time, publicly sticking to their relatively modest additional growth plans. We believe this sector has potential for several years and getting paid to wait is never a bad thing.
It’s a bit of a small sample size, but during the recent rally, greater than 90% of stocks in the S&P 500 traded above their 50-day moving average. Since 2003, there have been 14 such separate occurrences. Looking one year out, the market has been positive 13 out of 14 times, and the average 12-month return is approximately 18%. Our slight lean (no real conviction here just yet) is that the next pullback in the market (happening as I type), should be a very attractive entry point for clients where we’ve recently lightened up/rebalanced, or for investors with cash on the sidelines.
– Adam