“There are far better things ahead than any we leave behind.” – C.S. Lewis”
Hi all,
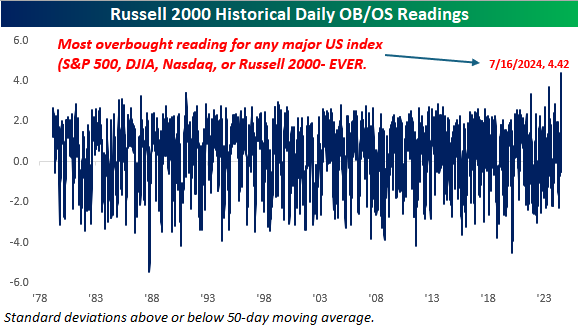
As I write this post, the Nasdaq is down about 5% for the year, the Russell 2000 (small businesses) is down about 7% for the year, and the S&P 500 is down 2%. Traditionally, after a 20%+ year for the S&P 500, weakness in the first few months is to be expected. Also, post-election years tend to be weak at the beginning as well.


As was the case in 2024, we saw an 8% decline from all-time highs in mid-March 2024 until late April of that year. For the moment, we view the current state of affairs in much the same way.
But Adam, haven’t you seen the tariffs, and the unprecedented political unrest!
Of course, I have. There’s always a new REASON why the outlook starts to sour, and some of these shakeouts turn into larger problems, but trying to predict or front-run the specific falling of dominoes among countless variables just doesn’t feel possible (or smart, for that matter).
I’d rather just wait on the sidelines until all this gets figured out.
I know. You and everyone else. In the latest survey of the American Association of Individual Investors (AAII), we saw the fourth most bearish reading in the last 30+ years. The other three readings? October 2008, March 2009, and September 2022. In the general vicinity of major market low points (best times to buy).
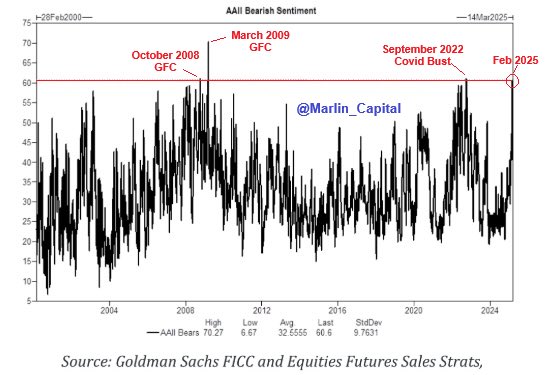
But in today’s case, we’re only a couple percentage points off all-time highs. The S&P 500 made a new all-time high 13 days ago. How did we get from all-time highs to bear market bottom sentiment? Some people point to the fact that the survey is outdated, no longer representative of stock market positioning, etc. They may be correct, but my research includes many different data points, and this has always just been one piece of the puzzle. The other pieces are not flashing anywhere near the bearishness we see from the AAII survey, but that’s also changing as the market continues to struggle.
Something more interesting is that last week when the S&P 500 was only 2% off it’s all-time high, 60% of the stocks in the index were down 10% or more from their respective 52-week highs, and 33% of them were down 20% or more. As the kids would say, “Index investing, for the win.”
We never know where the money will rotate, but we do know that people will look elsewhere when growth stock momentum starts to weaken. Who would have thought that European stocks would be up almost 9% while the S&P struggles to tread water? No one. That’s why we’ve stuck with geographic diversification.
“And why is investing in stocks a good way to do this? Well, because every day, hundreds of millions of people wake up, go to work, and produce goods and services at companies. Ultimately, by being an owner in those companies, you’ll get paid for their efforts via dividends and earnings growth. It’s like riding capitalism’s coattails.” That’s from Eric Balchunas, author of The Bogle Effect.
Don’t get short-sighted on the opportunity the market is giving us, and learn to embrace the short-term uncertainty. We think we’ve got more downside to go, but perhaps not too much more. We will be prepared when it’s time to capitalize again (just as we did in late 2022, March 2020 and December of 2018).
Turn off the TV. Go to a restaurant on a Saturday night, or talk to a small business owner. Use more of your eyes than your ears in times like these.
Talk soon,
Adam