Hi all,
In our previous post, we mentioned remaining cautious in the short-term even though the market showed no real signs of slowing down. As it happens, the final trading day of March marked the intraday all-time high in the S&P 500 (5264), and as of last week, the S&P was almost 6% lower. The technology-heavy Nasdaq 100 found itself 7.5% lower and the representation of small business in America, the Russell 2000, was 9.5% lower.
It is likely we are nearing some sort of short-term bounce, but the $10,000 question remains: Will this be a buying opportunity on our way back to all-time highs, or do we still have more work to do on the downside before stocks find their footing?
“The work of a pullback in a bull market is to unwind over-aggressive positioning, drain excess optimism, reset expectations and take prices down to meet fundamental buyers’ conviction.” – Michael Santoli
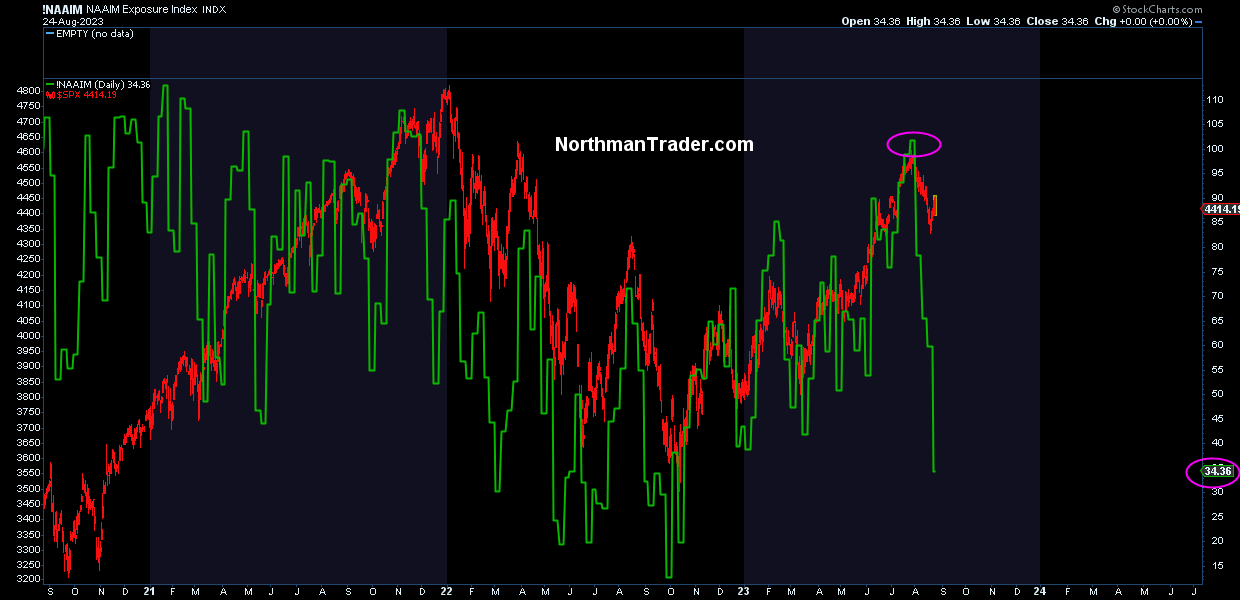
This is precisely what has happened. Less than a month ago, 82% of stocks were above their 20-day moving averages. Last week, that number sat below 8% (got as low as 6% in October of 2022, which happened to be a fantastic buying opportunity).
We are believers that history remains a guide. Over the last 100 years, when the S&P 500 had been up more than 10% by the end of March, it had closed the following nine months of the year green 12 out of 13 times.
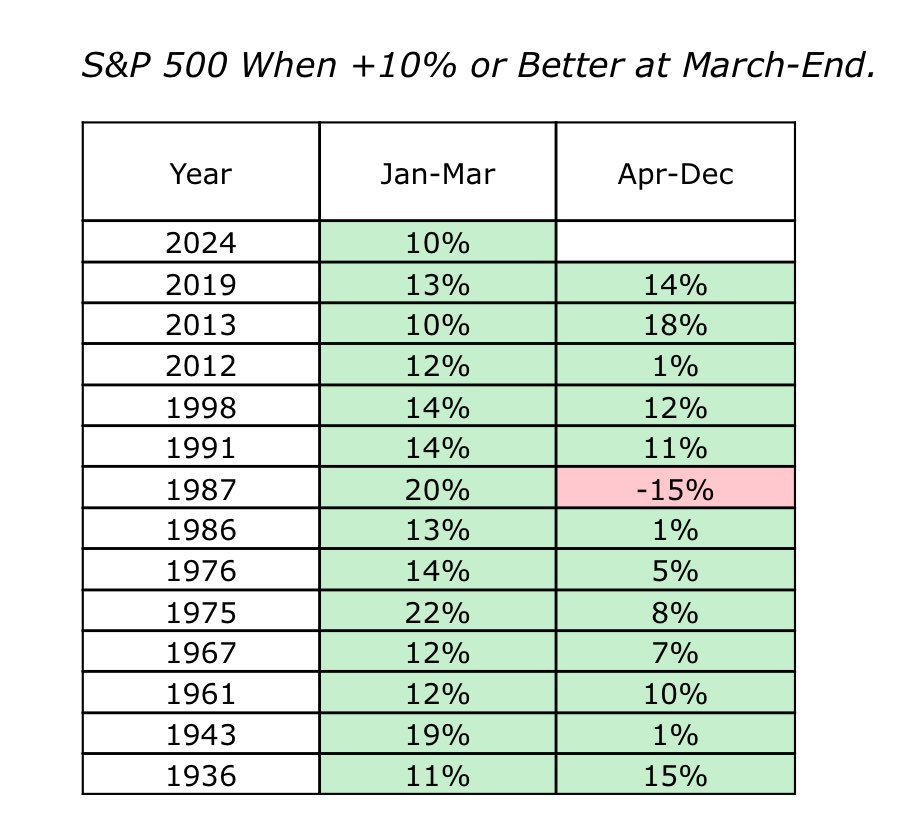
Assuming this still holds true for 2024, that would portend a gain of at least 5-6% from current levels. But with short-term interest rates holding very steady, a 9-month treasury bill can earn roughly 4% over the balance of 2024 with zero risk. Herein lies the dilemma. When will market participants decide to start moving out of very attractive risk-adjusted returns, and back into the stock market?
Our guess is that this happens sooner rather than later, but we believe that in order to justify moving out of high-yield savings accounts and short-term treasury bills, investors will start to go bargain hunting rather than choosing the darlings of the past year. We’re looking for stocks and sectors that are well-off recent highs, still providing quality business models which have stood the test of time, and potentially pay an attractive dividend yield (as a nice transition from treasuries). For a decent portion of our client base, we have been waiting for a better market entry point and been quite content to sit and collect interest. We believe that time is coming to an end, and for those of you with the appropriate risk tolerance and time horizon, we put additional capital to work last week.
We have some supportive price levels a few percentage points lower than here, but the entire market is looking at these. For instance, the Jan 2022 high for the S&P 500 is around 4800. This would be the first test of the breakout from the levels in late January, but all tests are not passed. The problem with focusing only on levels is that it disregards the most important indicator of all: price. Are the majority of stocks going up? No. Has there been a change in market sentiment? Yes, but not enough to consider it a major buy signal, in our opinion.
For those of you with additional cash on the sidelines, you will likely hear from us in the coming weeks in order to prepare to get those dollars to work in the short-term. We have no idea whether or not the pullback extends to 4800 or 4500 or 4200. Picking a number, while disregarding the current market environment is a terrible way to manage allocations, but we need to be prepared for all eventualities, including positive ones (gasp).
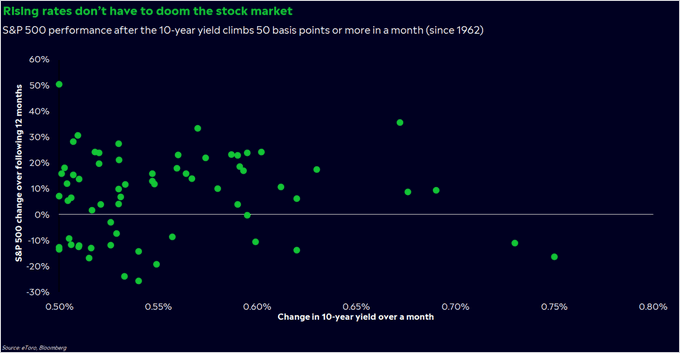
The Federal Reserve is meeting today and tomorrow, and tomorrow’s press conference should provide a little more clarity into the market’s patience level as it grips with the possibility of a “higher for longer” interest rate environment.
– Adam